|
|
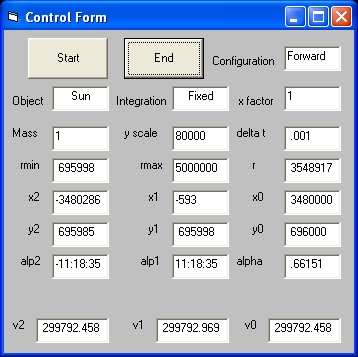
- The Start command is used to start the program
- The End command is used to terminate the program
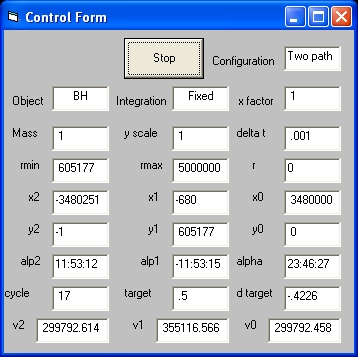
- The Stop command is used to stop the simulation
The original program is written in QBASIC. For background information goto: Program "Light.bas": Light Bending around the Sun
|
|
|
|
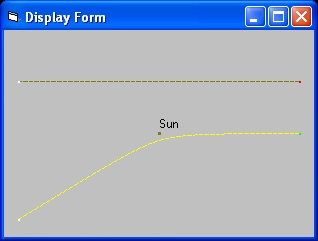
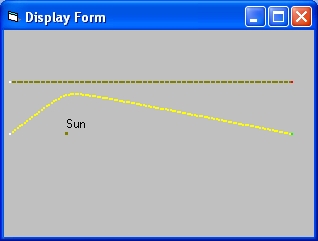
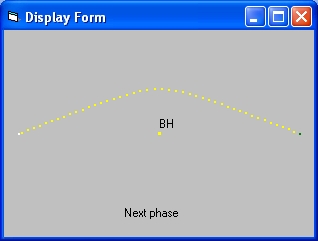
The display at the left shows the result of the simulation i.e. two lines: A "brown" line and a "yellow" line.
|
|
The most important difference between "Backward" and "Forward" is, that in the "Backward" configuration the observer is at a "fixed" position and the chalenge of the simulation is to draw the path of a light ray starting from a "fixed" location towards this "fixed" Observer. As you can see from the simulation this goes in many tries. At each try the parameter cycle is increased. Both the "source" and the "Observer" are at the same height or distance in vertical direction At the end the simulation again shows two lines: A brown line and a yellow line.
|
|
|
| Object | Configuration | Integration | Mass | v1 | v2 | Cycle |
| Sun | Forward | Fixed | 1 | 299792.969 | 299792.458 | |
| Sun | Forward | Fixed | 100 | 299843.595 | 299792.459 | |
| Sun | Forward | Fixed | 1000 | 300304.412 | 299792.557 | |
| Sun | Backward | Fixed | 1 | 299792.969 | 299792.458 | 8 |
| Sun | Backward | Fixed | 100 | 299843.528 | 299792.458 | 11 |
| Sun | Backward | Fixed | 1000 | 300297.917 | 299792.458 | 11 |
| Jupiter | Forward | Fixed | 0.000954 | 299792.462 | 299792.458 | |
| BH | Two path | Fixed | 1 | 355116.566 | 299792.614 | 17 |
| BH | Two path | Fixed | 1 | 339919.761 | 300039.478 | 17 |
|
The parameter alpha 1 is the angle near the source between the path of the lightray from the source and the straight line between the source and observer The parameter alpha 2 is the angle near the observer between the path of the lightray towards the observer and the the straight line between the observer and source |
| # | object | mass | Integration | Configuration | x factor | rmin | x0 | alp1 | alp2 | alpha | cycle |
| 1 | Asymetric | 100000 | Variable | Two path | 10 | 1298538 | 34800000 | -2:21:39 | 9:21:55 | 11:43:34 | 23 |
| 2 | Asymetric | 200000 | Variable | Two path | 20 | 2597085 | 69600000 | -2:21:39 | 9:21:54 | 11:43:34 | 23 |
| 3 | Asymetric | 250000 | Variable | Two path | 25 | 3246352 | 87000000 | -2:21:39 | 9:21:55 | 11:43:34 | 24 |
| 4 | Asymetric | 100000 | Variable | Two path | 20 | 1888928 | 69600000 | -1:40:09 | 6:38:57 | 8:19:06 | 18 |
| 5 | Asymetric | 125000 | Variable | Two path | 25 | 2361163 | 87000000 | -1:40:09 | 6:38:56 | 8:19:06 | 15 |
| 6 | BH | 1 | Variable | Two path | 10 | 2132505 | 34800000 | -3:44:05 | 3:44:05 | 7:28:11 | 20 |
| 7 | BH | 2 | Variable | Two path | 20 | 4264976 | 69600000 | -3:44:05 | 3:44:05 | 7:28:11 | 20 |
| 8 | BH | 4 | Variable | Two path | 10 | 4041720 | 34800000 | -7:29:09 | 7:29:09 | 14:58:18 | 16 |
| # | object | mass | Integration | Configuration | x factor | alp1 | alp2 | cycle |
| 1 | BH | 1 | Variable | Two path | 100 | -1:10:49 | 1:10:49 | 19 |
| 2 | BH | 2 | Variable | Two path | 200 | -1:10:49 | 1:10:49 | 21 |
| 3 | Asymetric | 100000 | Variable | Two path | 640 | -0:17:42 | 1:10:48 | 37+ |
| 4 | Asymetric | 130000 | Variable | Two path | 832 | -0:17:42 | 1:10:48 | 29 |
..........>.......A
                        .
                            .
Star                           B
                                 .
                                   .
                * S *                .
              *       *                x Earth
             *         *                 .
-------------*   Sun   *                   .
             *         *                     .
              *       *
                 *  *
|
..>..A
             .
                   .
                       C
                           .
Star                          .
                                 B
                                   .
                *   S                .
              *       *                x Earth
             *         *                 .
-------------*   Sun   *                   .
             *         *                     .
              *       *
                 *  *
|
|
|
|
It is strange that this figure is wrong, because it raises the question what is wrong in the text.
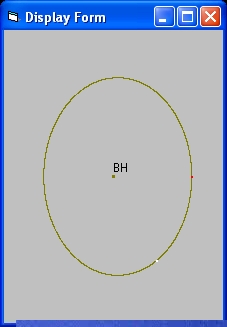
In each cas Select "Start" and roughly 10 seconds later select "Stop", because the simulation does not stop by it self
What the display shows is a photon which revolves around the BH. In principle you can have a circular disc (a cloud of photons) which rotates around the BH. This photons are invisible for an observer outside the BH. The red dot represents the initial position of the photon. The "white" dot represents the position when the simulation is stopped. |
|
Back to my home page: Contents of This Document